Pedestrian-Involved Accident Dashboard
Investigating the causes of pedestrian accidents in the state of Victoria-Australia using Tableau software
In this project, we were tasked with extracting insights from the accident dataset published by the Victoria state road and driving authority.
I chose the reduction of pedestrian fatalities and serious injuries as my insight. I adopted the "What, When, Where, Why" strategy for presenting my insights.
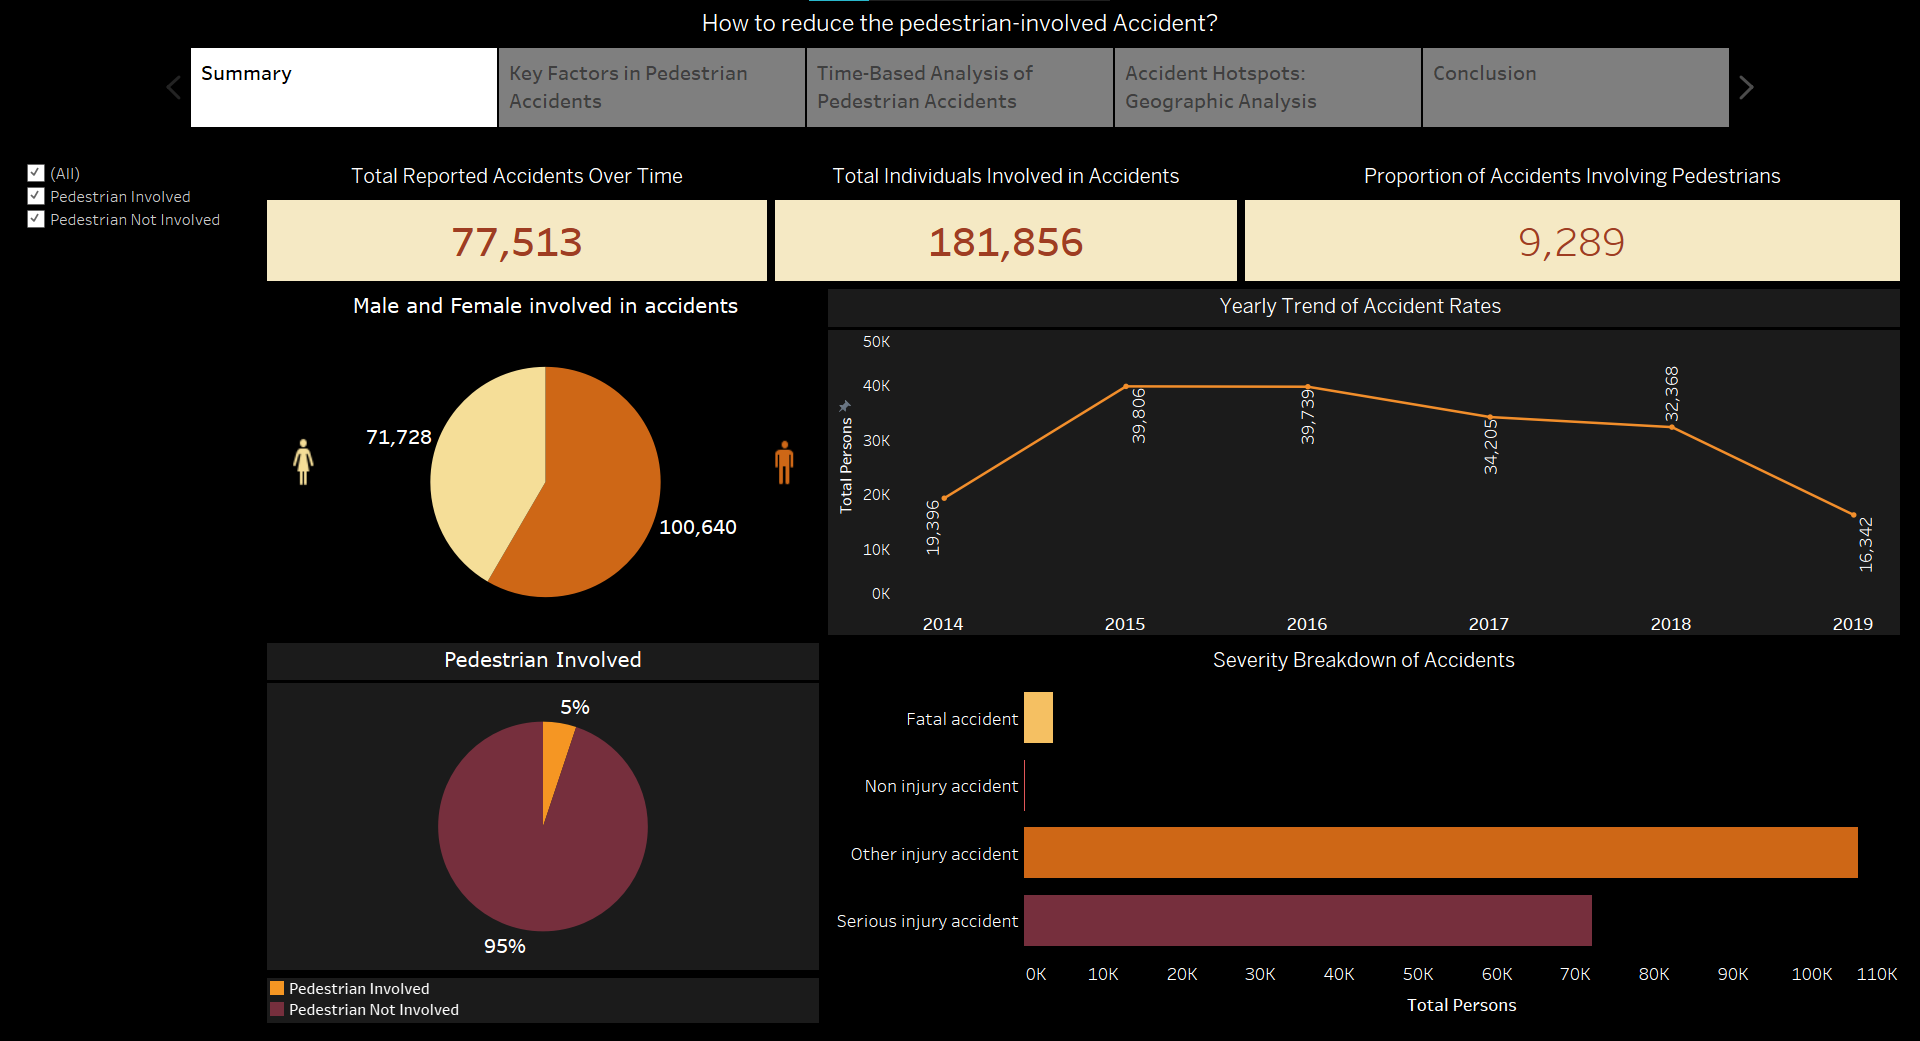
Initially, I displayed a general overview of the number of accidents, the severity of injuries, the number of individuals involved in accidents, and similar data.
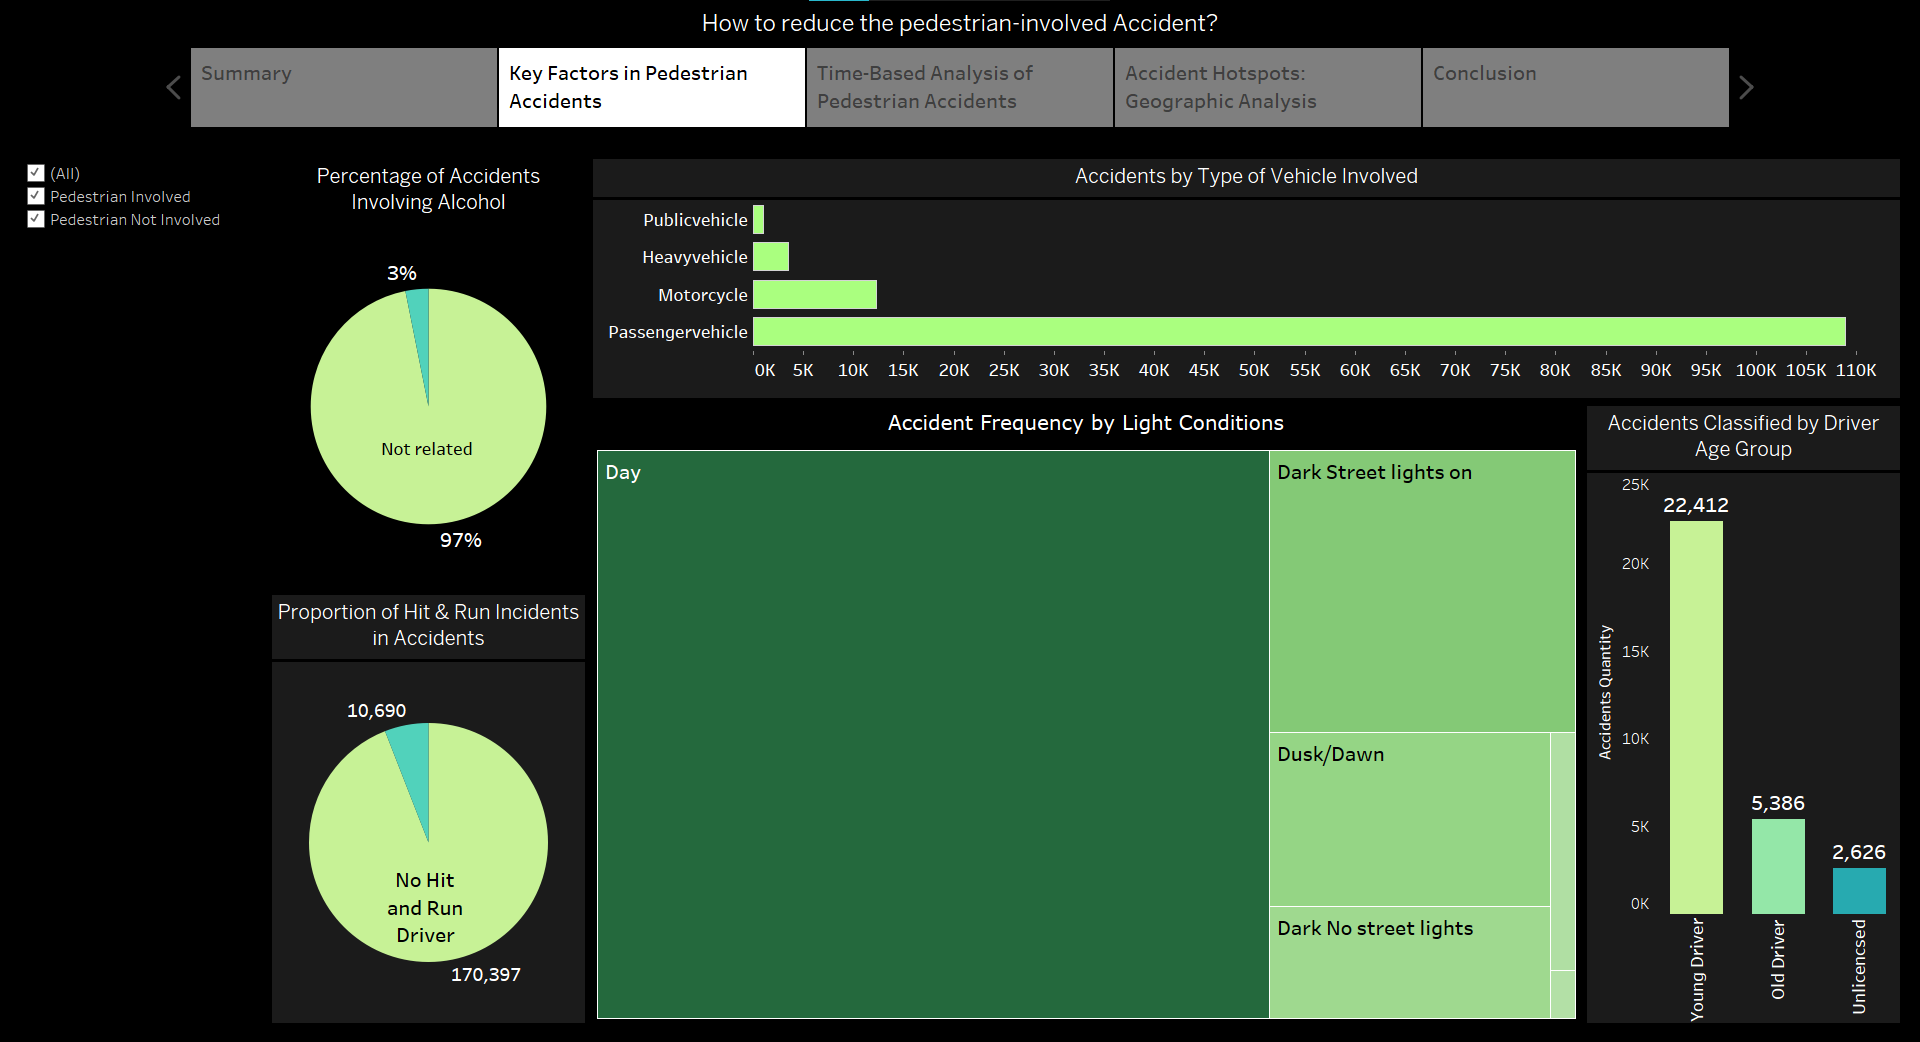
In the subsequent dashboard, I addressed some of the Key Factors in Pedestrian Accidents, demonstrating that accidents involving pedestrians are more likely to be caused by young drivers and contrary to popular belief, driver intoxication does not significantly increase accident rates.
I also showed that while most accidents occur during the day due to a higher presence of pedestrians, the rate of pedestrian accidents at night on dark streets is disproportionately high considering the fewer pedestrians, which was one of the insights derived from this report.
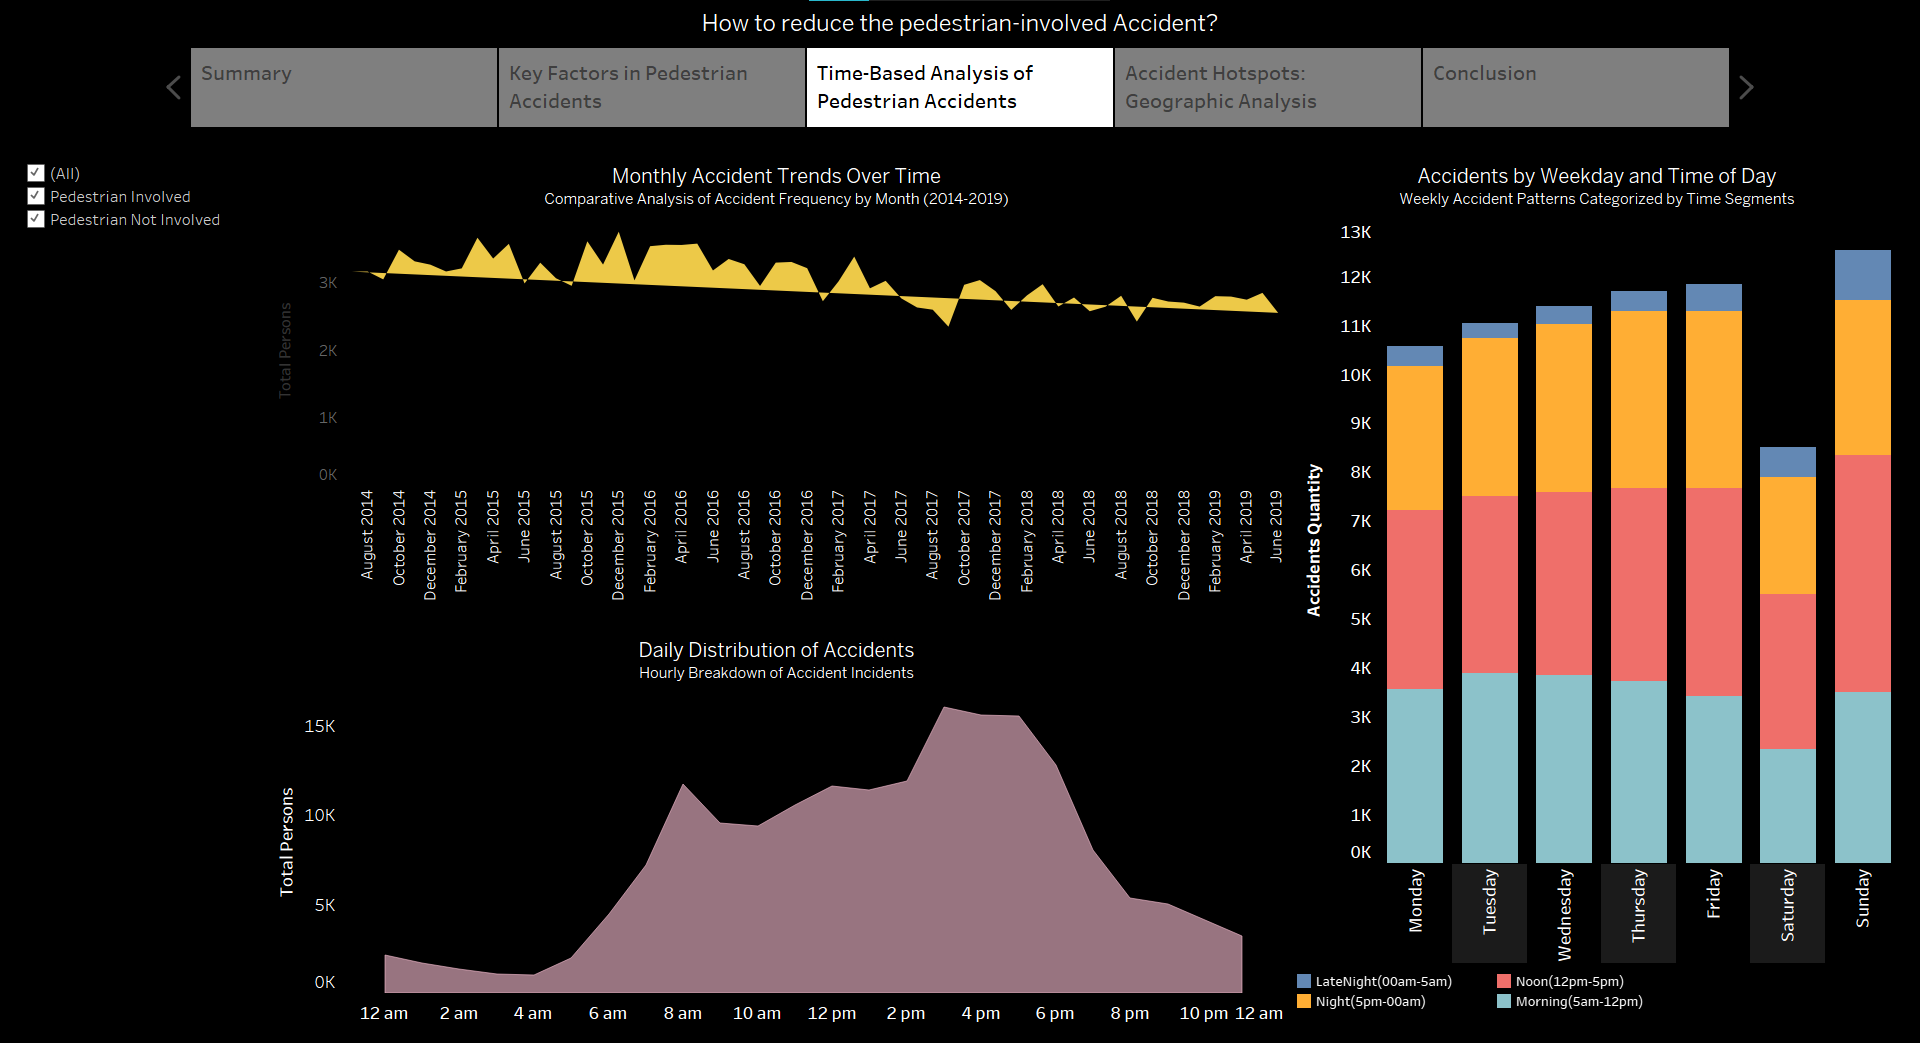
In the next dashboard, I conducted a Time-Based Analysis of Pedestrian Accidents, examining the number of accidents leading to pedestrian injuries or deaths by weekdays, hours of the day, and months of the year.
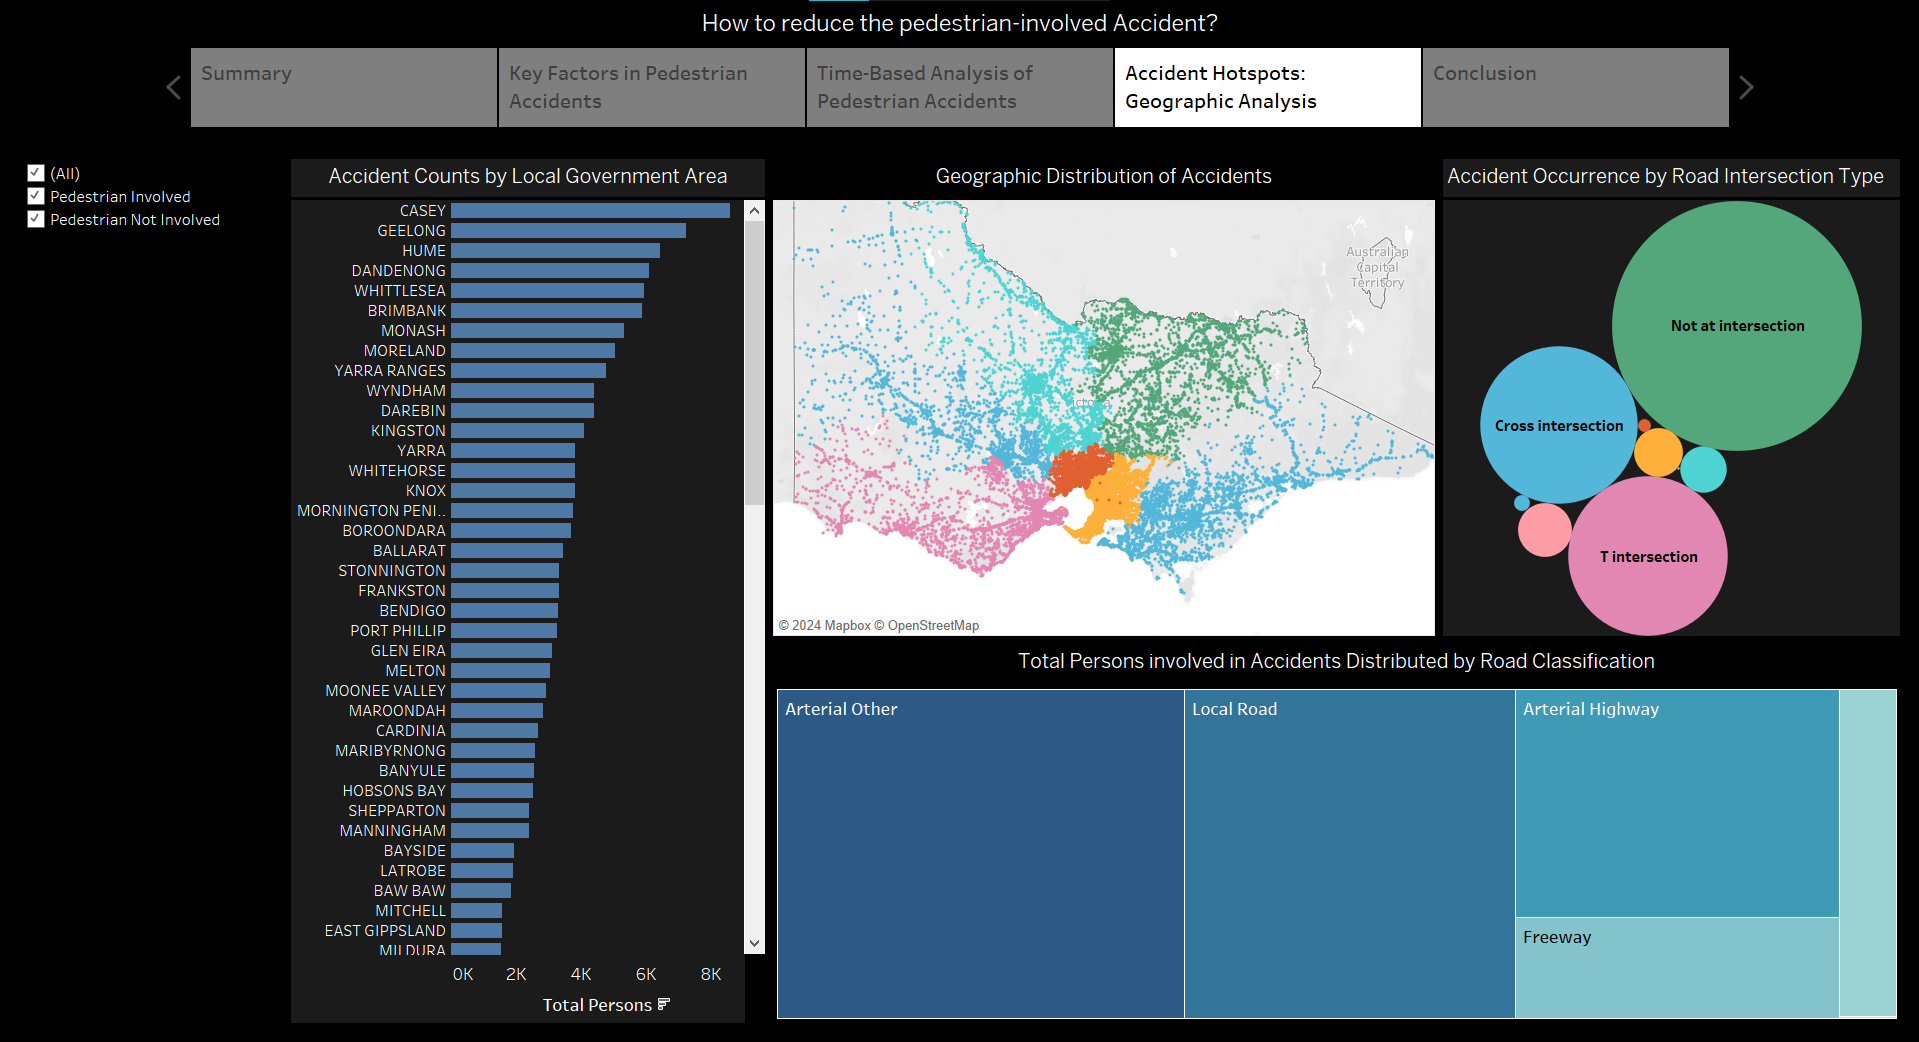
The following dashboard focused on Accident Hotspots: Geographic Analysis, where we found that most of these accidents occur in local areas and on the access roads to these locations.
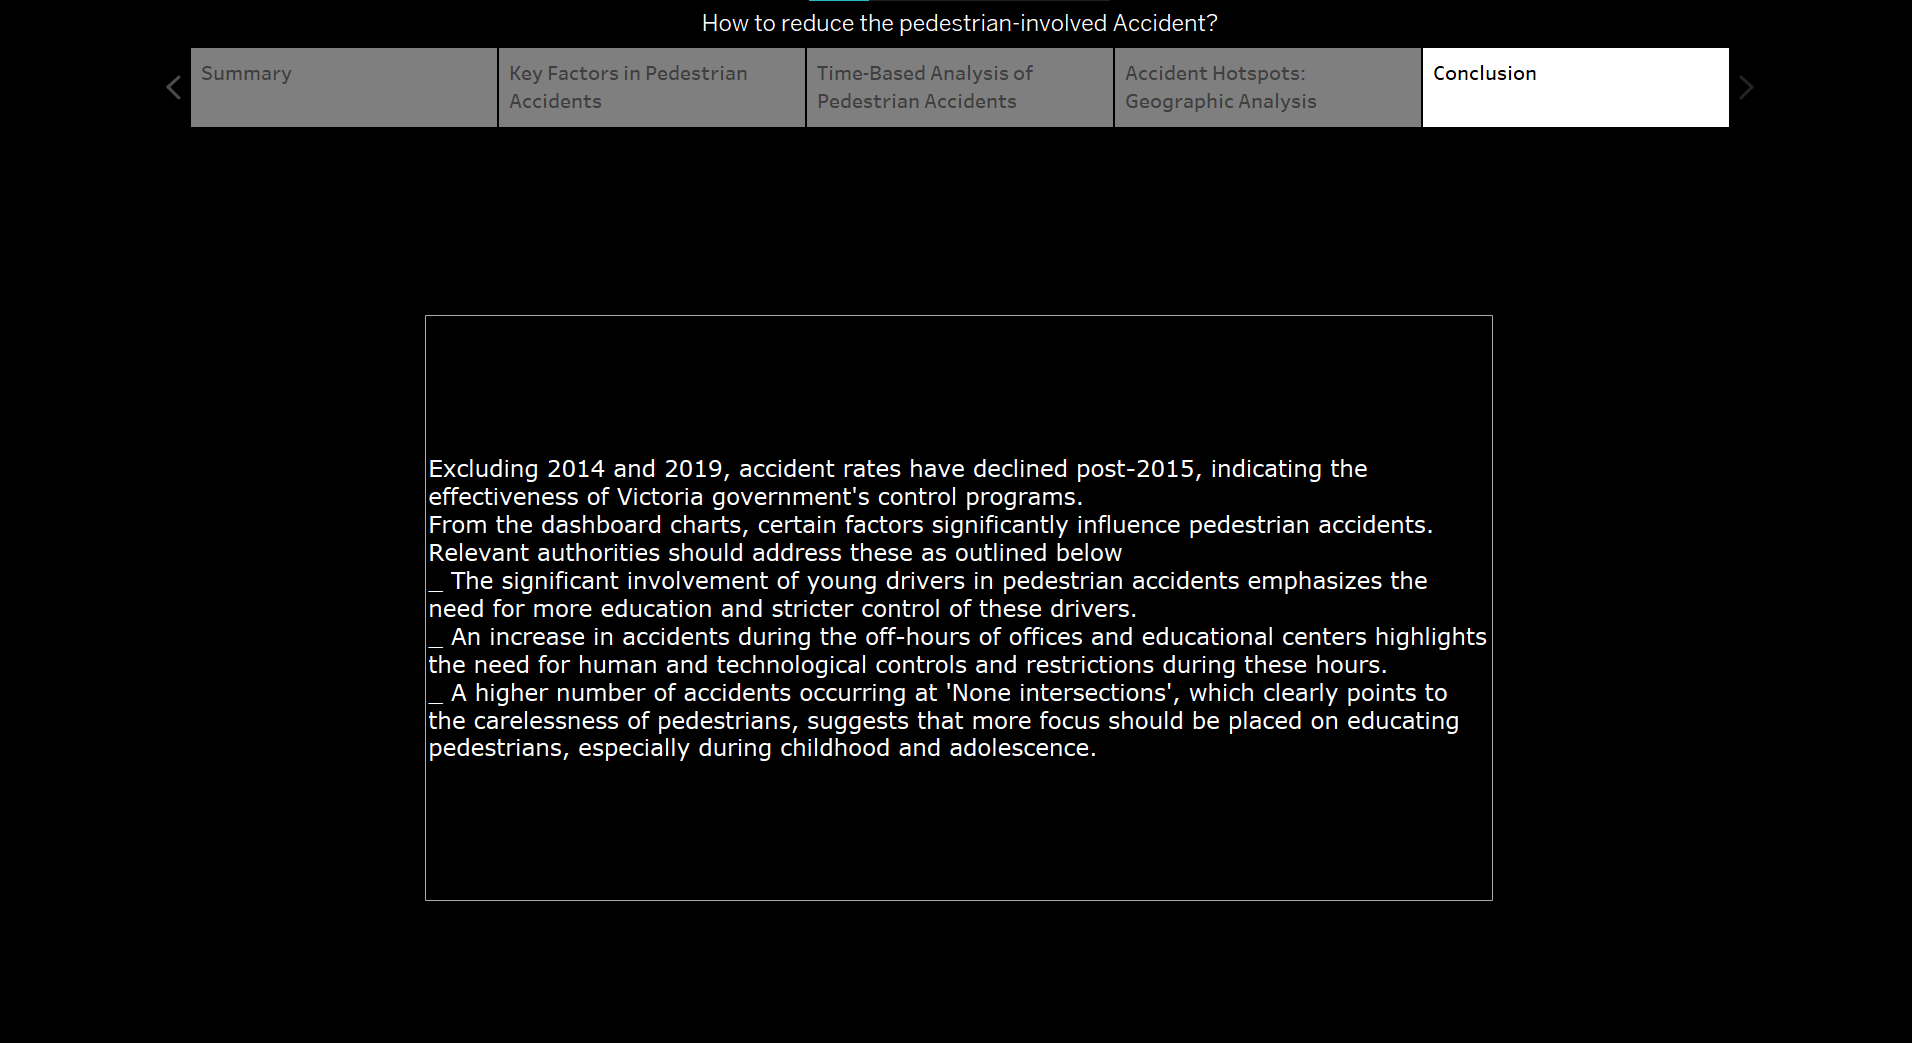
In the final dashboard, I presented a Conclusion or a form of Storytelling based on the information obtained from the dashboards.