Cumulative Application Trends Analysis
A Comparative Visualisation of Intake Periods using Power BI, DAX, and Python
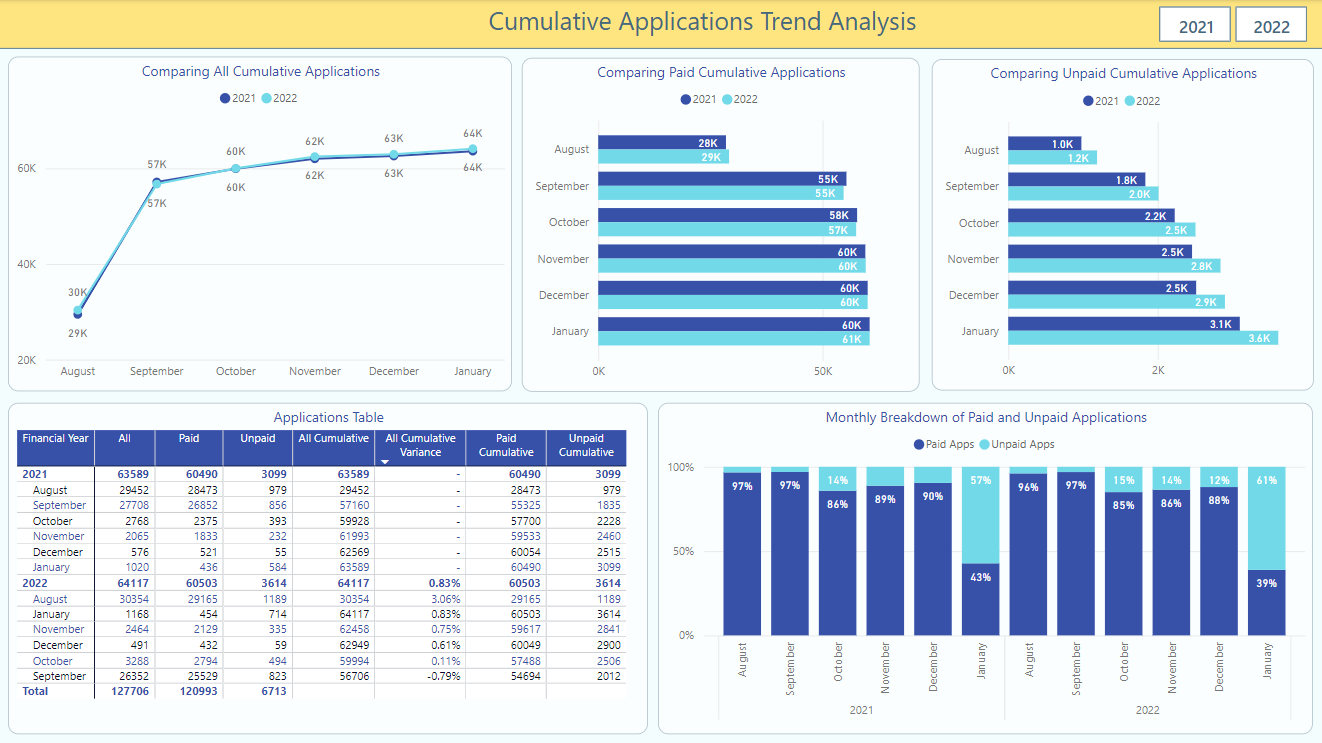
Project Overview:
This project involved processing and visualizing cumulative application data for two distinct intake periods (2021 and 2022). The datasets provided detailed records of both fully paid and unpaid tertiary applications received over several months, from August to January each year.
Challenges:
The main challenge was to merge and cleanse two separate datasets, ensuring the continuity of the time series despite the absence of applications on certain days.
Methodology:
1- Data Preparation and Cleaning:
- Merged two datasets for the years 2021 and 2022.
- Addressed issues such as duplicate records, incorrect data types, and logical data errors (e.g., discrepancies in the number of applications).
- Employed Python for data manipulation to showcase advanced data handling capabilities.
2- Data Analysis:
- Extracted relevant insights from the cleaned data, focusing on cumulative application counts during the specified periods.
3- Data Modelling:
- Created a dimension table (dim_date) to categorize data by financial years and facilitate correct sorting of months.
- Developed measures to calculate cumulative totals and variances in applications using DAX (Data Analysis Expressions).
4- Visualization:
Designed and implemented several visuals:
- Line charts for cumulative applications over time.
- Bar charts for monthly breakdowns of paid and unpaid applications.
- Detailed application tables and percentage comparisons by month.
5- Insights and Impact:
- Identified a possible pattern in data anomalies, such as an exact match in total applications across two different years, suggesting areas for further investigation.
- Provided a comprehensive view that enabled stakeholders to assess application trends and make informed decisions.
Technologies Used:
- Python for data preprocessing.
- Microsoft Power BI for data modelling and visualization.
Outcome:
The visualizations delivered crucial insights into application trends, helping the management team to strategize more effectively for future intake periods. The project not only enhanced operational understanding but also demonstrated the capability to handle complex data analysis tasks efficiently.