Human Resource Dashboard
Implementing a comprehensive Human Resources Data Visualization using Power BI software
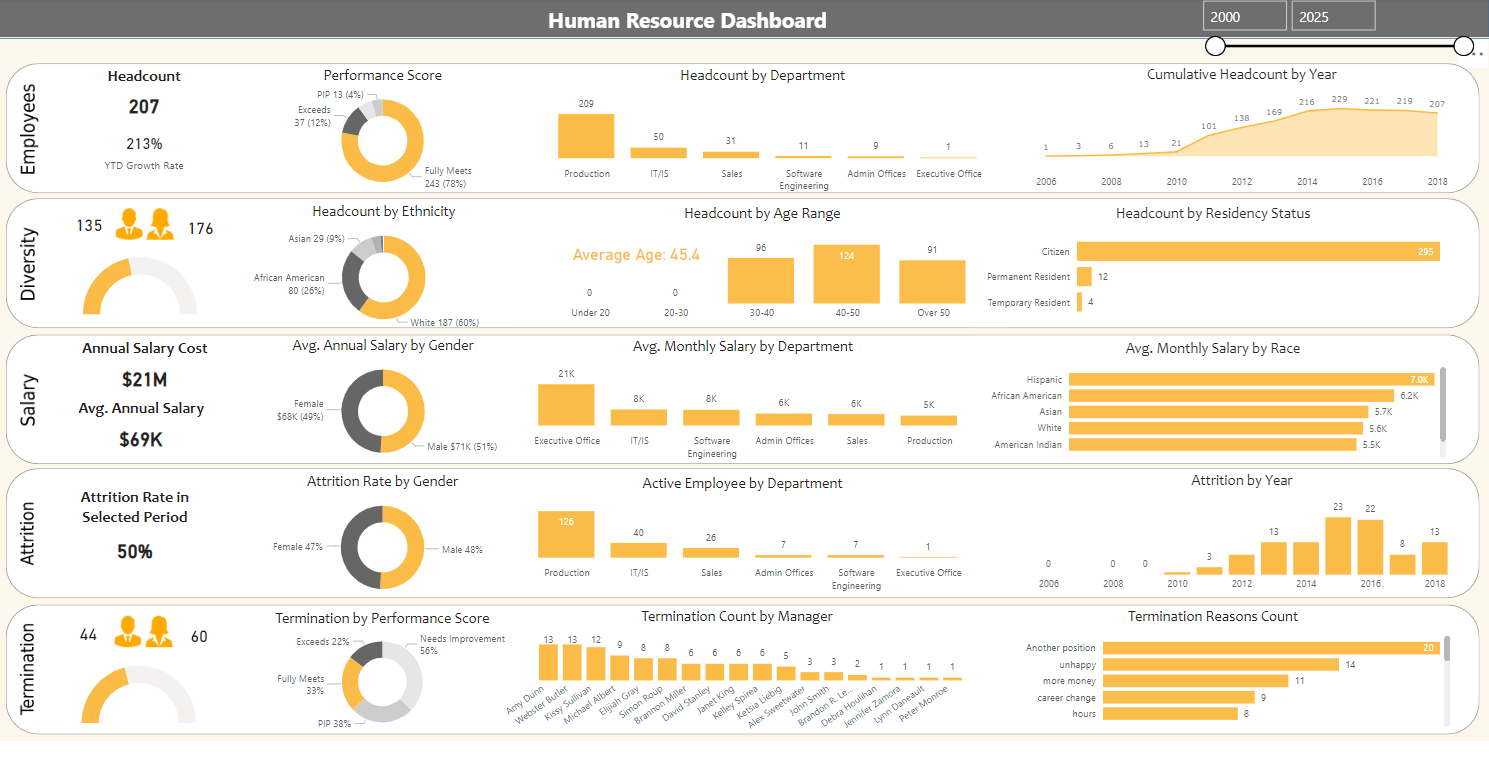
In constructing this dynamic Human Resource Dashboard, I employed a blend of SQL queries and DAX (Data Analysis Expressions) in Power BI to create a rich, interactive data model. An SQL query was meticulously designed for the foundation to construct an accumulative data table, pulling from the raw dataset to drive the dashboard. This was essential in shaping the underlying data structure that supports the interactive elements of the dashboard.
WITH EmpCnt AS (
SELECT count([EmpID]) as cnt
,year(cast([DateofHire] as date)) as [year]
FROM [Test].[dbo].[HRDataset_v14]
group by year(cast([DateofHire] as date))
)
, TermCnt AS (
SELECT count([EmpID]) as cntterm
,year(cast([DateofTermination] as date)) as [Terminationyear]
FROM [Test].[dbo].[HRDataset_v14]
where year(cast([DateofTermination] as date)) <> 1900
group by year(cast([DateofTermination] as date))
)

SELECT
    [year],
	case when cntterm is null then
	SUM(cnt) OVER (ORDER BY [year])
	else
    SUM(cnt) OVER (ORDER BY [year]) - SUM(cntterm) OVER (ORDER BY [year])
	end
	AS CumulativeSum,
	case when cntterm is null then
	0
	else
    SUM(cntterm) OVER (ORDER BY [year])
	end
	AS CumulativeTerminationSum,
	case when cntterm is null then
	0
	else
    cntterm
	end
	AS TerminationSum
FROM
    EmpCnt a
	left join TermCnt b
	on [year] = [Terminationyear]
Attrition Rate Measure: DAX
Attrition Rate = CALCULATE( COUNTROWS('EmployeeTable'), 'EmployeeTable'[TerminationDate] <= TODAY() ) / CALCULATE( COUNTROWS('EmployeeTable'), ALL('EmployeeTable') )Headcount = CALCULATE( DISTINCTCOUNT('EmployeeTable'[EmployeeID]), 'EmployeeTable'[DateOfJoining] <= LASTDATE('Calendar'[Date]), ISBLANK('EmployeeTable'[TerminationDate]) || 'EmployeeTable'[TerminationDate] > LASTDATE('Calendar'[Date]) )Active Employees = COUNTROWS( FILTER( 'EmployeeTable', 'EmployeeTable'[DateOfJoining] <= TODAY() && (ISBLANK('EmployeeTable'[TerminationDate]) || 'EmployeeTable'[TerminationDate] > TODAY()) ) ) These DAX expressions allowed me to dive deep into understanding the nuances of Termination and Attrition, vital HR concepts that can significantly affect strategic decision-making. I also explored the dynamics of headcount and active employees, providing the client with actionable insights into their workforce management and planning. By integrating SQL and DAX, I ensured that the dashboard was a visual treat and a robust analytical tool that stood on the bedrock of accurate, real-time data processing. In addition, I made a "dim date" table using DAX formulas in my star data model. This project was a testament to the power of combining database querying with advanced data modelling techniques to deliver a comprehensive and insightful analytical solution.